ISPF-Dokumentation
Seite mit Funktionen, Installation und Betrieb. Inhalt aus der englischen Dokumentation docs/en (kanonische Sprache des Repositories).
1. Funktionale Merkmale
Who This Product Is For
| Role | Responsibilities | Start here |
|---|---|---|
| Operator | Monitoring, control, work queue, reports | Operator guide |
| Administrator | Object tree, dashboards, workflow, users | Getting started → Web Console |
| Solution developer | Deploy applications, functions, operator UI, reports | Solution developer guide |
| Platform developer | Drivers, REQ-PF, core extensions | Roadmap |
| DevOps / SRE | Deployment, profiles, infrastructure | Deployment |
What ISPF Solves
A typical SCADA/MES stack grows as separate modules: OPC server, historian, HMI, workflow, reports. ISPF unifies them around one object tree with a single API and UI.
Diagram (Mermaid) — see full docs on GitHub.
Core principle
Business logic lives on the platform — in models, variables, events, functions, and workflows of the object tree. The platform supplies generic engines (CEL, bindings, BPMN, script runtime, drivers); the solution configures them declaratively. Bundle deploy packages configuration, not a separate runtime. Summary for developers and agents: application-principles. Details: architecture. Backlog: roadmap.
Key capabilities
- - Unified model — device, dashboard, workflow, and alert rule are tree nodes; logic uses variables, events, functions, and BPMN.
- - Bundles, not core forks — industry solutions deploy as configuration into platform mechanisms (applications).
- - Stack — Spring Boot 4, Java 25, PostgreSQL/TimescaleDB, React 19, REST + WebSocket; optional NATS/MQTT/Keycloak.
- - ~60 driver packs (not inside
ispf-server.jar; maturity varies — see drivers). - - AGPL v3 platform — optional Enterprise dual-license; driver packs and application bundles may use separate terms (license, plugins).
Product Capabilities
1. Object tree
The central platform abstraction. Each node has a path (root.platform.devices.pump-01), type, variables, events, and functions.
| Node type | Purpose |
|---|---|
PLATFORM, DEVICES, DASHBOARDS, … | System catalogs (root.platform.*) |
DEVICE | Physical or virtual device with a driver |
DASHBOARD | HMI screen (layout JSON + widgets) |
WORKFLOW | BPMN automation process |
ALERT / CORRELATOR | Automation rules (tree nodes) |
MODEL | Template (blueprint) for creating objects |
APPLICATION | Registered deploy application |
USER / ROLE | Users and roles (mirror of security API) |
CUSTOM | Arbitrary container (fallback) |
Details: object-model, glossary.
2. Models (templates)
BlueprintDefinition describes a set of variables, events, functions, and CEL bindings. MIXINs auto-apply only when a non-empty Applicability condition (CEL) is set. The demo blueprint mqtt-sensor-v1 is a fixture applied via templateId.
Details: blueprints, 0018-fixture-models-and-cel-applicability.
3. Device drivers
The DeviceDriver SPI connects protocols to object variables. The administrator configures driverId, configuration, and point mapping; the runtime polls the device and writes values into the tree.
Demo after first startup:
| Object | Driver | Purpose |
|---|---|---|
demo-sensor-01 | virtual | Sinusoidal temperature + alarm binding |
snmp-localhost | snmp | localhost SNMP agent |
Details: drivers.
4. Dashboards and HMI
Dashboard Builder (admin) and Operator HMI (read-only) use the same widgets:
| Category | Widgets |
|---|---|
| Values | value, indicator, sparkline, chart, gauge |
| Tables | object-table, card-grid, work-queue |
| Navigation | dashboard-link (switch between screens) |
| SCADA | scada-mimic (P&ID / single-line mimic diagrams) |
| Other | text, iframe, image, event-log, function-button |
Widgets bind to data via objectPath (static) or selectionKey (dynamic row selection from a table).
Details: dashboards, scada, widget reference: widgets.
5. Workflow (BPMN)
Visual BPMN editor in the Web Console. Supports service tasks (including application function calls), user tasks (operator queue), gateways with CEL conditions, parallel branches, signals, and NATS.
Details: workflows.
2. Installation
Try ISPF (≈15 minutes)
Option A — all-in-one JAR (fastest)
Download ispf-*-portable.zip from GitHub Releases (JDK 25). Unzip, then:
# Windows: double-click start.bat
# Linux / macOS:
./start.sh
No PostgreSQL needed — the portable build uses embedded H2 (data/ispf-local.mv.db after first start).
Open http://localhost:8080 — login admin / admin. Then continue from §2 Sign in (use port 8080 instead of 5173).
Option B — from source
Requirements
| Component | Version |
|---|---|
| JDK | 25 (Gradle toolchain; JavaLanguageVersion.of(25)) |
| Gradle | Wrapper in the repository |
| Node.js | 20+ |
| Docker Desktop | Optional — only for PostgreSQL / Keycloak / MQTT full stack |
1. Start API + console
# Terminal 1 — local profile (H2 file DB; syncs a small set of dev driver packs)
./gradlew :packages:ispf-server:bootRun --args="--spring.profiles.active=local"

# Terminal 2 — Web Console
cd apps/web-console && npm install && npm run dev| URL | Purpose |
|---|---|
| http://localhost:8080 | Admin console (all-in-one JAR) |
| http://localhost:5173 | Admin console (Vite dev) |
| http://localhost:8080?mode=operator | Operator HMI (all-in-one JAR) |
| http://localhost:5173?mode=operator | Operator HMI (Vite dev) |
| http://localhost:8080/api/v1/info | Version / capabilities |
| http://localhost:8080/actuator/health | Health |
bootRun uses syncDevDriverPacks by default (≈8 packs). Full catalog: -Dispf.driver.packs=all.
2. Sign in (local profile)
Default empty DB seeds: admin / admin (also developer / developer, operator / operator). Use the Web Console login screen.
API (Bearer token — required for most calls):
TOKEN=$(curl -s -X POST http://localhost:8080/api/v1/auth/login \
  -H "Content-Type: application/json" \
  -d '{"username":"admin","password":"admin"}' | jq -r .token)

curl -H "Authorization: Bearer $TOKEN" http://localhost:8080/api/v1/objects
X-ISPF-Role header auth is off by default (ispf.security.local-role-header-enabled=false). Do not rely on a Role selector in the header for normal local use. Details: security.
3. First steps in the UI
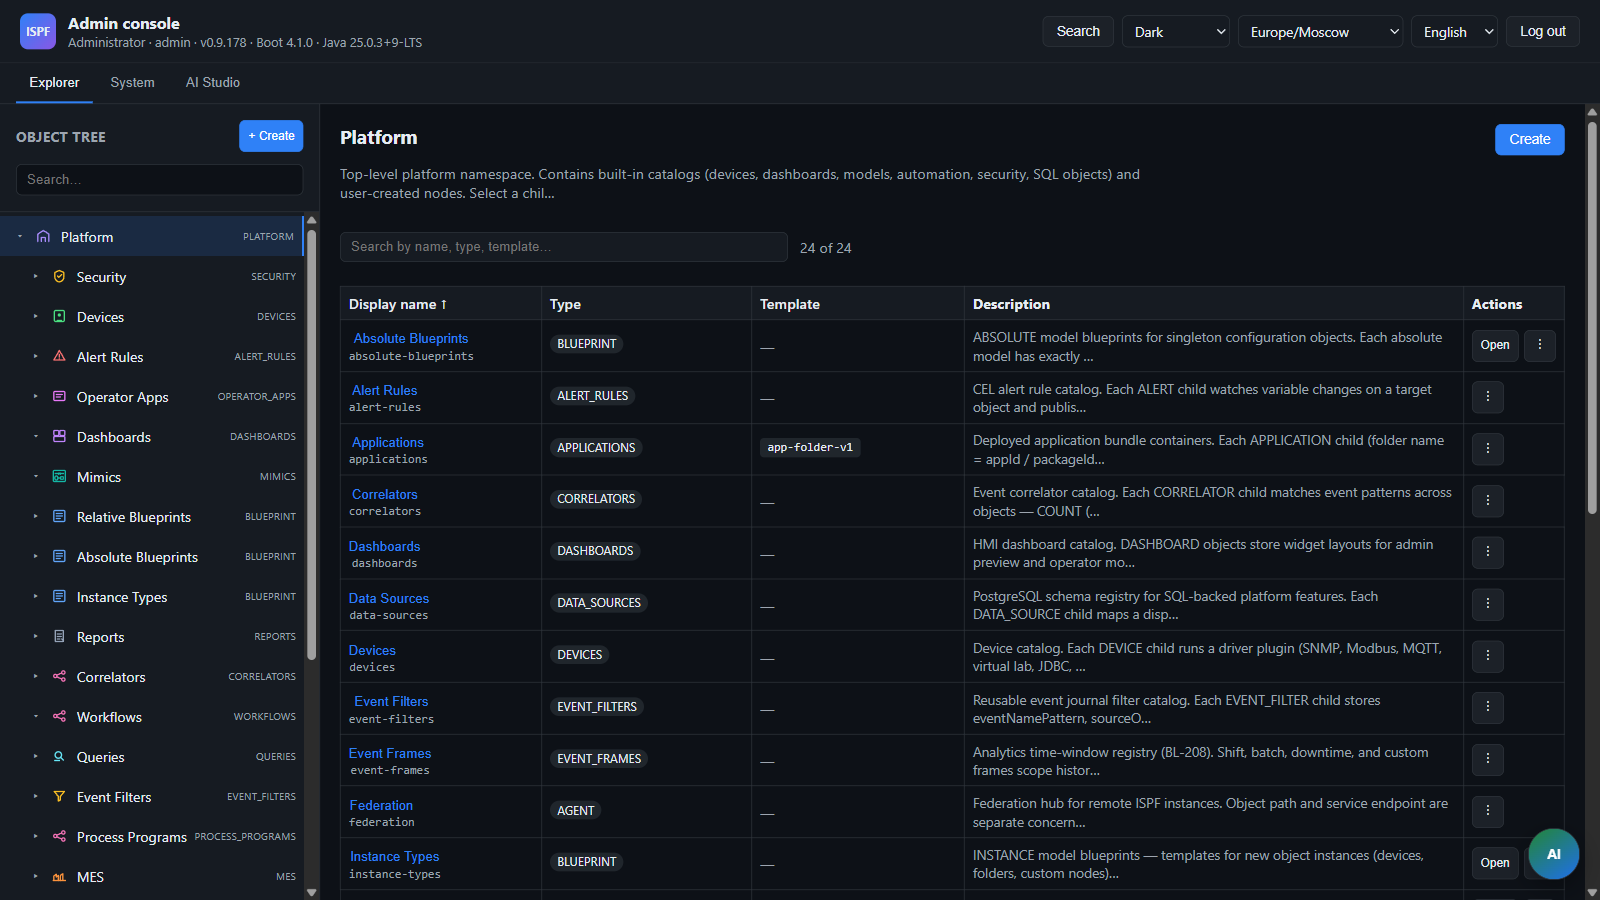
- 1. Open the object tree — branch
root.platform. - 2. Expand
devices→demo-sensor-01— temperature, threshold, alarm variables. - 3. Double-click
dashboards.demo-sensor— Dashboard Builder. - 4. Expand
alert-rules→temperature-threshold-exceeded— CEL alert. - 5. Double-click
workflows.demo-alarm-handler— BPMN demo. - 6. Open operator mode:
http://localhost:8080?mode=operator(all-in-one JAR) orhttp://localhost:5173?mode=operator(Vite), or log in asoperator.
Language: use the console language selector (English recommended for screenshots / OSS).
4. Start the demo sensor driver
curl -X POST "http://localhost:8080/api/v1/drivers/runtime/start?devicePath=root.platform.devices.demo-sensor-01" \
  -H "Authorization: Bearer $TOKEN"
Temperature is a sine wave; when the threshold is exceeded, alarmActive and the alert rule may fire.
Next after the demo
- - Product overview · Object model · Dashboards · Automation
- - Solution developer guide — build a real bundle
- - Architecture · API
3. Betrieb
Operator Guide
Guide for users with the operator role — equipment monitoring, work queue tasks, events, and reports.
Product overview: product. UI technical details: web-console.
Sign In
- 1. Open the Web Console:
http://<host>:8080(all-in-one JAR) orhttp://<host>:5173(Vite dev) - 2. Sign in with an operator account (demo:
operator/operator). - 3. After sign-in, Operator HMI opens — full-screen mode without the object tree or editors.
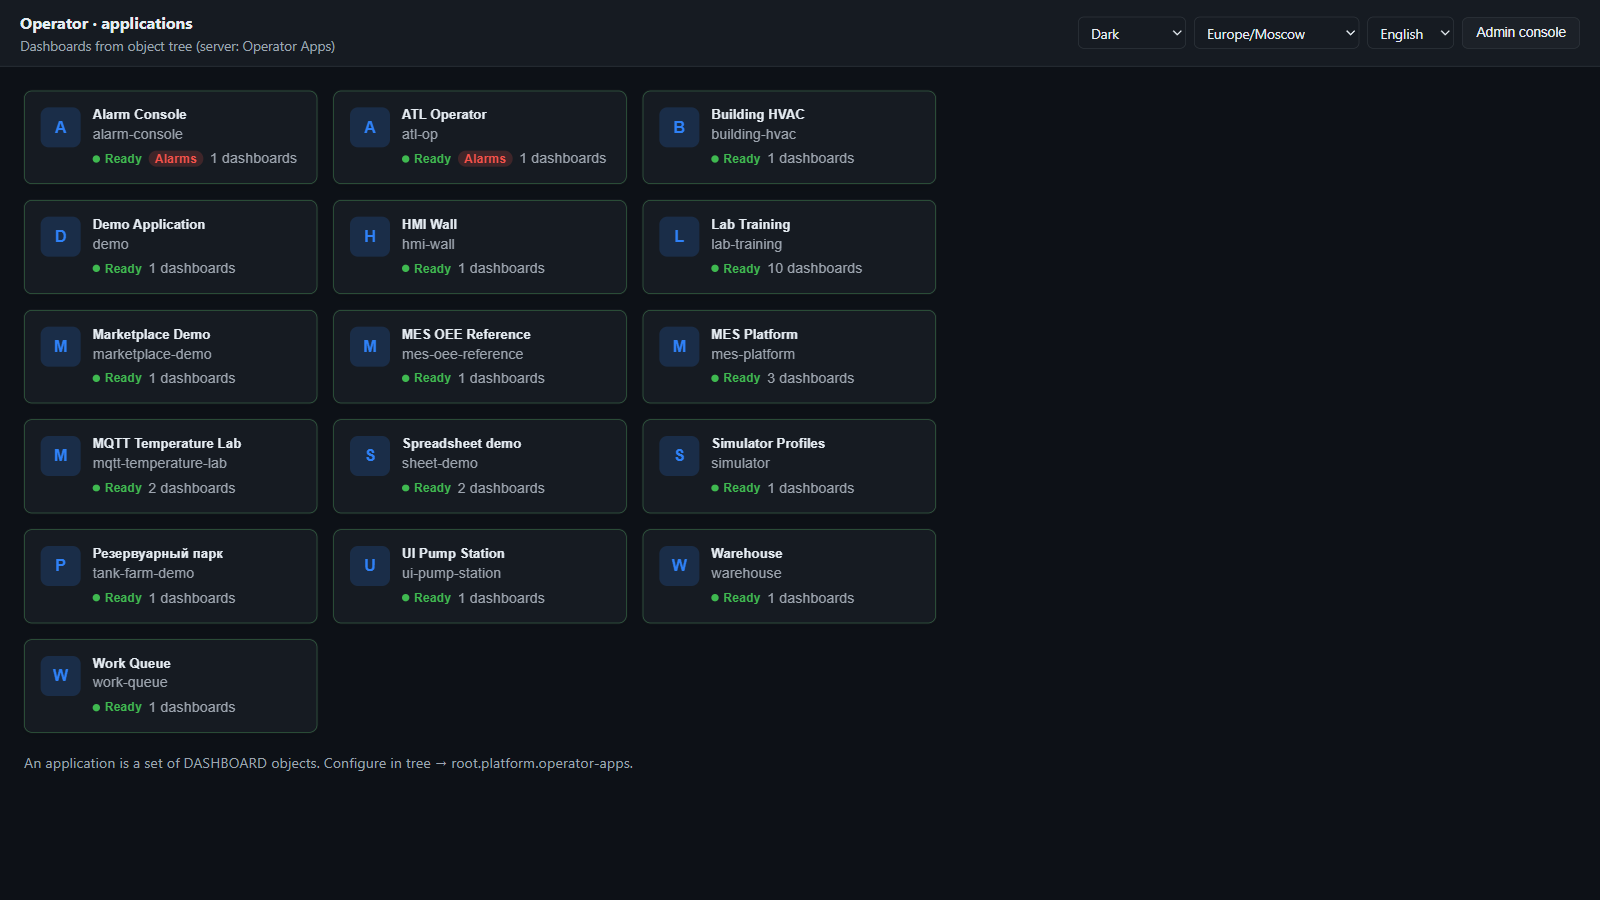
If you have the admin role but need operator mode:
http://<host>:8080?mode=operator
http://<host>:5173?mode=operator
For a specific application:
http://<host>:8080?mode=operator&app=platform
http://<host>:5173?mode=operator&app=platform
Application auto-start
An administrator can configure auto-start for your account: after sign-in, the configured operator app opens immediately (for example, platform or an industry application).
Operator HMI
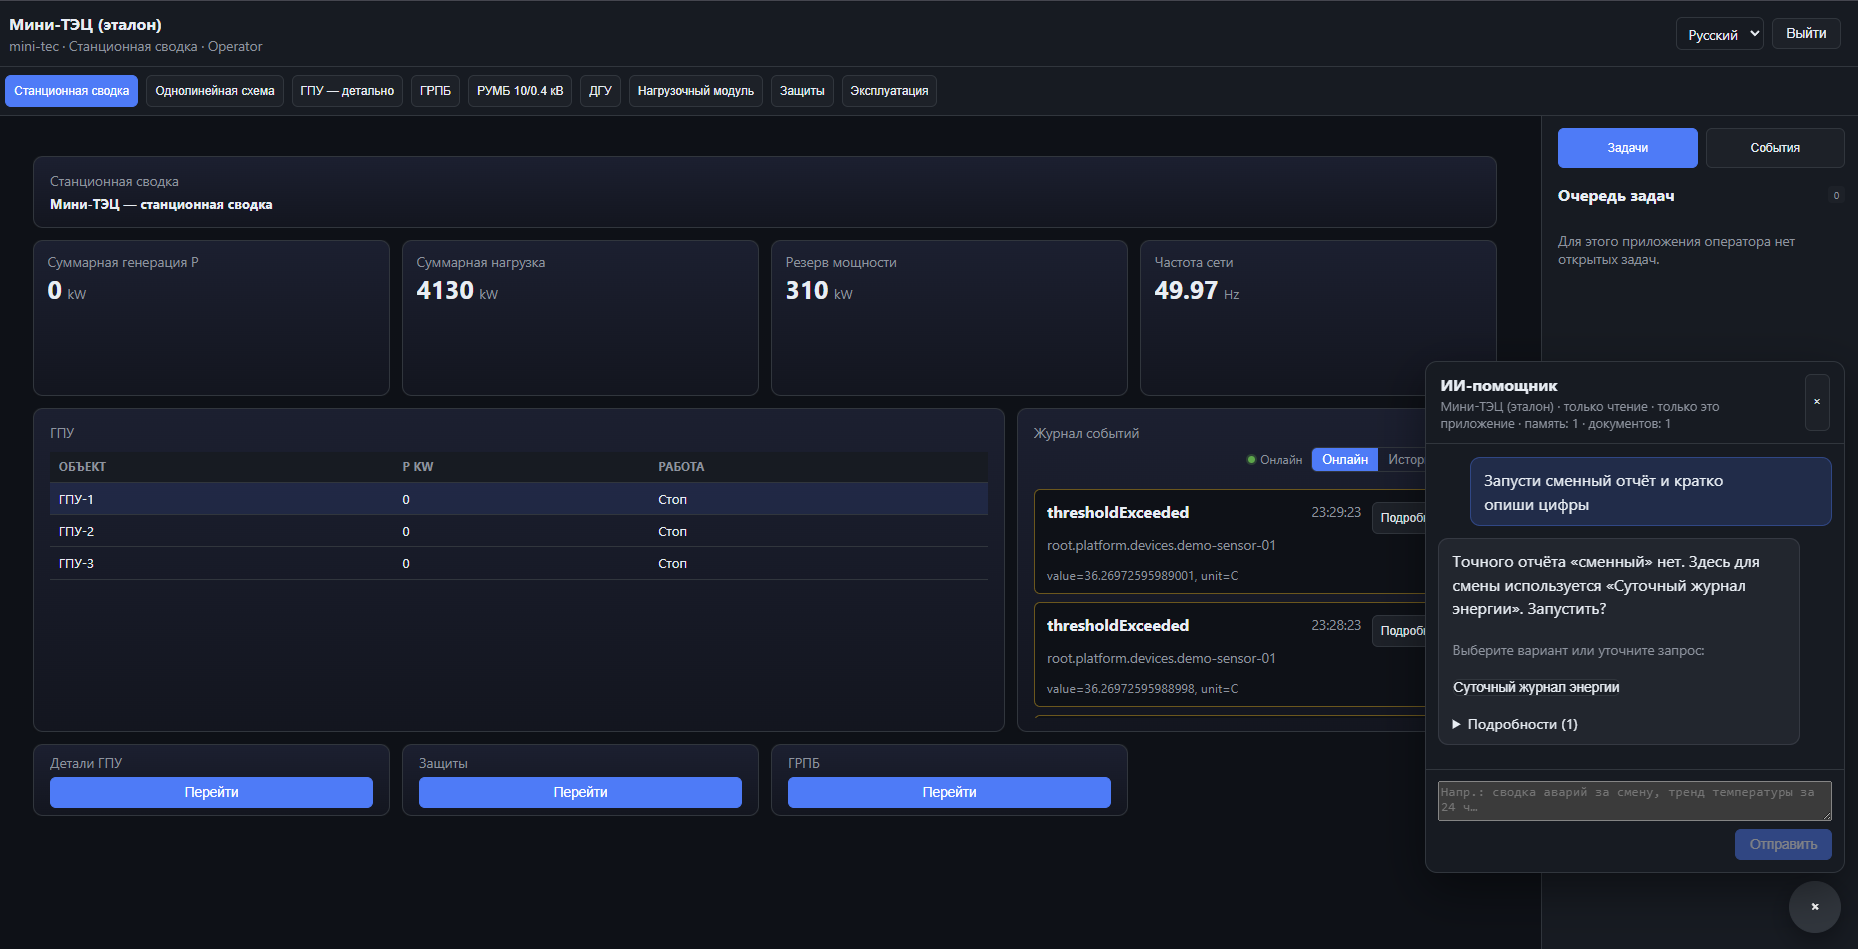
Left: dashboard (widgets, charts, tables). Right: Work Queue / event journal sidebar. Bottom-right: shift AI assistant (read-only).
What operators can do
| Action | Available |
|---|---|
| View dashboards and values | ✓ |
| Live data updates (WebSocket) | ✓ |
| Invoke functions (dashboard buttons) | ✓ |
| Work queue: claim / complete | ✓ |
| Event journal | ✓ |
| Edit layout, objects, workflow | ✗ |
| User management | ✗ |
| Application deploy | ✗ |
Working with Dashboards
Navigating between screens
If the application has multiple dashboards, they appear as tabs at the top of the screen. Switch tabs to move between screens (for example, “Overview”, “Details”, “Reports”).
A dashboard-link widget on a screen can open another dashboard — in the current tab or in a modal.
On-screen widgets
| Widget | What it shows | Operator actions |
|---|---|---|
| value / indicator | Current variable value | View only |
| chart / sparkline | Trend graph | View only |
| gauge | Scale | View only |
| object-table | Table of objects | Click row → selection for other widgets |
| card-grid | Object cards | Click → selection |
| function-button | Action button | Click → invoke object function |
| work-queue | List of BPMN tasks | Claim / Complete |
| event-log | Event journal | View, filter |
| spreadsheet | A1 grid with formulas | Enter values and formulas (if editable) |
| text / image | Static content | — |
Full reference for all widgets (what each setting does, examples): widgets.
On screens with a device table (object-table widget with selectionKey), clicking a row updates linked widgets — charts and indicators show data for the selected device.
Spreadsheet widget
The spreadsheet widget is a table with Excel-style cell addressing (A1, B2, …). Values and formulas recalculate on screen without server round-trips (except live binding cells).
Detailed instructions: spreadsheet-widget.
Summary:
| Element | Purpose |
|---|---|
| Formula bar | Selected cell address on the left; value or formula for editing on the right |
| Grid | Displayed results; in free mode — any cell is editable (except binding cells) |
| Toolbar | In free mode: undo/redo, copy/paste, CSV export |
Selection and input (free mode):
- 1. Click a cell — select it; contents appear in the formula bar.
- 2. Double-click or F2 — edit directly in the cell.
- 3. Formula bar — enter a number (
10), text, or formula (=A1+B2); Enter — save. - 4. Tab / Shift+Tab — next / previous cell; arrow keys — move in the grid.
Keyboard shortcuts (free mode, when focus is on the grid):
| Keys | Action |
|---|---|
| F2 | Edit cell |
| Enter | Open editing / after entry — move down |
| Esc | Cancel editing |
| Ctrl+Z / Ctrl+Y | Undo / redo |
| Ctrl+C / Ctrl+V | Copy / paste cell |
Persistence: entered values and formulas are saved automatically (dashboard session or object variable — as configured by the developer). After F5, data remains if the widget is bound to a variable (persistMode: variable).
Lab example: dashboard root.platform.dashboards.lab-calculator — template calculator (configured mode): only cells A2 and B2 are editable; sums recalculate automatically.
Dynamic object selection
On screens with a device table (object-table widget with selectionKey), clicking a row updates linked widgets — charts and indicators show data for the selected device.
Work Queue
The Work Queue holds BPMN user tasks assigned to operators.
Typical flow
- 1. A workflow starts (manually by an administrator or triggered by an event).
- 2. The process reaches a user task → the task appears in the Work Queue.
- 3. Operator clicks Claim — the task is assigned to them.
- 4. Operator performs the action (for example, confirms on the dashboard).
- 5. Clicks Complete — the workflow continues.
Where to look
- - Sidebar on the right in Operator HMI — Work Queue panel.
- - work-queue widget on a dashboard — embedded queue on the screen.
If a task is unavailable
- - The task is already claimed by another operator — wait for completion or contact an administrator.
- - Workflow status is
STOPPED— no new tasks are created.
Event Journal
The Event Journal sidebar shows recent platform events:
- - Sensor threshold exceeded
- - Alert rule fired
- - Manual event fire
- - System notifications
Levels: DEBUG, INFO, WARNING, ERROR, CRITICAL.
An event-log widget on a dashboard can filter events for a specific object.
4. Deployment (Prod / Docker)
Docker Compose
docker compose up -d| Service | Image | Ports | Credentials |
|---|---|---|---|
| postgres | timescale/timescaledb:latest-pg16 | 5432 | ispf/ispf |
| redis | redis:7-alpine | 6379 | — |
| nats | nats:2.10-alpine (-js) | 4222, 8222 | — |
| mosquitto | eclipse-mosquitto:2 | 1883 | config: deploy/mosquitto/ |
| keycloak | keycloak:26.0 dev | 8180 | admin/admin |
Volume: ispf_pg_data.
Compose profiles are not used — all services start together.
Spring Boot Server
Artifact: :packages:ispf-server:bootRun or JAR from build/libs/.
Environment variables
| Variable | Default | Description |
|---|---|---|
ISPF_DB_URL | jdbc:postgresql://localhost:5432/ispf | JDBC URL |
ISPF_DB_USER | ispf | DB user |
ISPF_DB_PASSWORD | ispf | DB password |
ISPF_SERVER_PORT | 8080 | HTTP port |
ISPF_OAUTH_ISSUER | Keycloak realm URL | JWT issuer |
ISPF_MQTT_ENABLED | false | MQTT integration |
ISPF_MQTT_BROKER | tcp://localhost:1883 | Broker URL |
ISPF_NATS_ENABLED | false | NATS integration |
ISPF_NATS_URL | nats://localhost:4222 | NATS URL |
ISPF_BOOTSTRAP_FIXTURES_ENABLED | true | Demo/lab fixture models and demo nodes (mqtt-sensor-v1, …). See 0018-fixture-models-and-cel-applicability. Prod VPS: vps-deploy-direct.ps1 sets false; lab demo — vps-factory-reset.sh --fixtures. |
Profiles
| Profile | File | Scenario |
|---|---|---|
| default | application.yml | PostgreSQL + JWT |
| local | application-local.yml | H2 file, Bearer after POST /api/v1/auth/login (X-ISPF-Role off by default) |
| dev | application-dev.yml | Full stack + MQTT/NATS |
| test | application-test.yml | H2 memory, tests |
Database
- - Flyway — migrations on startup (
ddl-auto: validate); locations perRelationalDialect(see 0037-relational-core-portability) - - local: H2
./data/ispf-local(PostgreSQL compatibility mode) - - prod: PostgreSQL; TimescaleDB extension (docker image
timescale/timescaledb) — hypertablesvariable_samplesandevent_history, retention 90d (0009-timescaledb-retention, 0015-event-history-timescale)
Storage modes
| Mode | Metadata (ISPF_DB_*) | Events | Variable history |
|---|---|---|---|
| Single DB (default) | PostgreSQL | ISPF_EVENT_JOURNAL_STORE=jdbc | ISPF_VARIABLE_HISTORY_STORE=jdbc |
| Split telemetry | PostgreSQL | clickhouse / cassandra | clickhouse / cassandra |
Single DB is the standard scenario: configuration, objects, event_history, and variable_samples in one PostgreSQL. ClickHouse/Cassandra — only under high time-series load.
Optionally: ISPF_METADATA_DB_KIND (postgresql, h2, mssql, …) — see storage-portability-inventory.
Changing metadata engine (greenfield, before v1.0): new empty DB, Flyway baseline for the chosen dialect, configuration — import bundles. In-place PG→MSSQL migration is not supported.
Platform Data Sources (root.platform.data-sources.*): internal — schema in ISPF_DB; external — JDBC to external DB for reports and SQL bindings (not metadata).
Messaging
| Broker | Enable | Usage |
|---|---|---|
| MQTT | ispf.mqtt.enabled=true | Device drivers |
| NATS | ispf.nats.enabled=true | Workflow messageTask |
Production quick start (BL-127)
One command brings up the lab / localhost stack on a Linux host with Docker (PostgreSQL + Redis + ispf-server + nginx for UI). Not tied to VPS ispf.example.invalid.
Not for internet-facing production without hardening: ports are bound to 127.0.0.1, demo fixtures are disabled, default DB passwords (ispf/ispf) must be changed before exposing to the network. Images use pinned tags from deploy/air-gap-images.env. Full prod checklist: demostands.md § Production.
Requirements: Docker Engine + Compose v2, JDK 25 (for build), Node.js 20+ (for UI).
bash deploy/prod-quickstart.shThe script:
- 1. Builds
ispf-serverJAR (bootJar, no tests). - 2. Builds
apps/web-console(npm ci && npm run build). - 3. Copies JAR to
deploy/staging/ispf-server.jar. - 4. Starts
deploy/docker-compose.prod-stack.yml. - 5. Waits for readiness via
deploy/health-check.sh.
| Endpoint | URL |
|---|---|
| API info | http://127.0.0.1:8080/api/v1/info |
| Actuator health | http://127.0.0.1:8080/actuator/health (not proxied through nginx) |
| Web UI (nginx) | http://127.0.0.1:8088/ |
Stop:
docker compose -f deploy/docker-compose.prod-stack.yml downPostgreSQL volumes are preserved (ispf_prod_pg). Full cleanup: add -v.
Files:
| File | Purpose |
|---|---|
deploy/docker-compose.prod-stack.yml | postgres, redis, ispf-server (Temurin JRE + mounted JAR), nginx |
deploy/air-gap-images.env | Pinned image tags (shared with BL-128 air-gap pack) |
deploy/nginx-local-prod.conf | proxy /api/, /ws/ → server; static SPA (no /actuator/) |
deploy/health-check.sh | Poll /actuator/health + smoke /api/v1/info |
Prod VPS: for ispf.example.invalid, continue to use deploy/vps-deploy-direct.ps1 (direct SCP + staging), not this quick start.
Kubernetes Helm chart (BL-186)
Chart: deploy/helm/ispf. Installable with Helm 3.14+; lint/template smoke needs no cluster.
# Static smoke (local helm or Docker alpine/helm)
bash deploy/helm/ispf/validate.sh

# Install
helm upgrade --install ispf deploy/helm/ispf \
  --namespace ispf --create-namespace \
  --set secrets.dbPassword='change-me' \
  --set ispf.bootstrap.fixturesEnabled=false

# Runtime smoke
kubectl -n ispf rollout status deploy/ispf --timeout=180s
kubectl -n ispf port-forward svc/ispf 8080:80 &
curl -sf http://127.0.0.1:8080/actuator/health
curl -sf http://127.0.0.1:8080/api/v1/info| Artifact | Purpose |
|---|---|
deploy/helm/ispf/Chart.yaml | Chart metadata |
deploy/helm/ispf/values.yaml | Defaults (historian tiers, analytics replicas, edge hints) |
deploy/helm/ispf/validate.sh | helm lint + helm template gate (CI job helm-chart) |
deploy/helm/ispf/README.md | Install notes |
ARM edge on K8s: set edge.enabled=true / edge.arm64=true (see edge/arm64). Compose profile for Pi/gateways: BL-187.